
I run Uptime Kuma, and I'd be lying if I said the decision took much thought — for one app on one box, it's the obvious default. What most comparisons skip is the part that actually matters: they list features until every option sounds necessary, when the real question is much smaller. What do you need to know, and how bad is it if you find out five minutes late instead of thirty seconds late?
Uptime Kuma: the honest, slightly absurd option
Uptime Kuma is free, MIT-licensed, and does exactly what it says: HTTP, TCP, DNS, ping, and Docker checks, a status page, notifications to more than 90 services, and a UI simple enough that getting a first check running is a matter of minutes, not an afternoon. As a tool, there's very little to argue with. As a deployment decision, there's one thing worth being blunt about: running it on the same VPS it's supposed to be watching is a slightly absurd idea, because the one scenario it exists to catch — the box going down — is the exact scenario where it also goes down.
This isn't a knock on the software. It's a deployment mistake the software lets you make easily, because nothing in the setup flow stops you from pointing Uptime Kuma at localhost. The fix costs nothing: a second free-tier box, a spare Raspberry Pi, or genuinely just not self-hosting the checker at all and using a hosted free tier for that one job while keeping everything else self-hosted. Self-hosting is a good default for most of a stack. An uptime monitor is the one piece where the argument for hosted is strongest, because its entire value depends on not sharing a failure domain with what it watches. If you are scoping uptime kuma vs better uptime vs Grafana for a business rather than a codebase, XenGrowth's growth operations team covers that angle.
Better Stack: paying to remove that one problem entirely
Better Stack — most people still know it as Better Uptime, which was the product name before the company rebranded around a wider platform — sidesteps the self-hosting question by not giving you a server to run in the first place. You add a monitor URL, it checks from Better Stack's own infrastructure, and it alerts you regardless of what's happening to your box. Its own pricing page lists a free tier of 10 monitors and 10 heartbeats with 3-minute checks and a status page included, with 30-second checks reserved for paid plans. For one app, that free tier alone covers what most people actually need — you're trading a small amount of vendor dependency for the fact that the checker's uptime is now someone else's operational problem, not yours.
What you give up is control and depth. Uptime Kuma's status page and monitor list are yours to configure however you want, self-hosted alongside everything else. Better Stack's is a SaaS product with its own limits, its own release cadence, and a free tier that can change. Neither of those is a dealbreaker for a small app, but it's the actual trade, and it's worth naming instead of treating 'hosted' as automatically the more serious choice. The XenGrowth resource library covers the the operations side of this side of this.
Grafana and Prometheus: a different tool for a different question
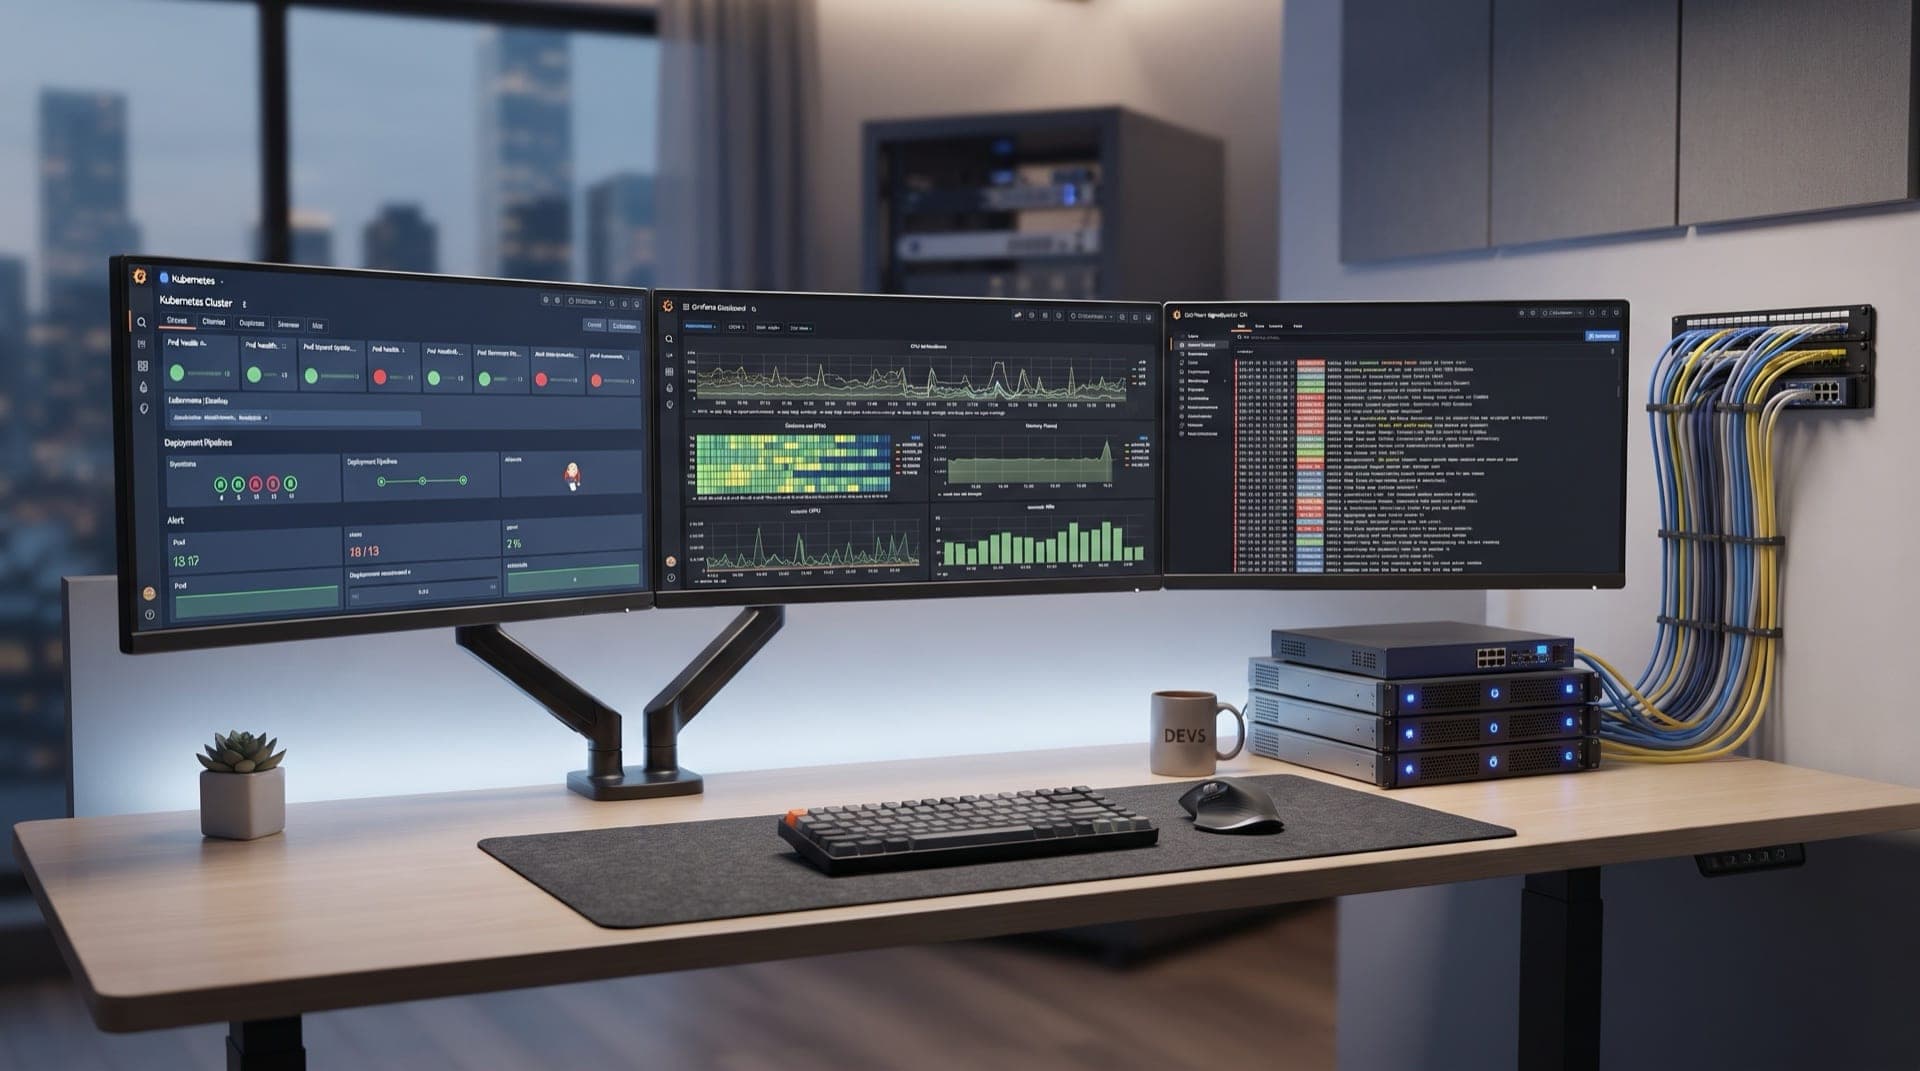
This is where a lot of comparisons quietly go wrong, because Grafana and Prometheus aren't really competing with Uptime Kuma or Better Stack — they answer a different category of question. An uptime checker tells you whether something is up. Prometheus, feeding Grafana, tells you the shape of what's happening while it's up: request latency by route over the last hour, memory growth across three services, a custom business metric nobody built a pre-made dashboard for. That's genuinely more powerful, and it's also genuinely more to run.
Standing up Prometheus and Grafana yourself means running two more stateful services, configuring scrape targets, writing your own dashboards or importing ones that mostly fit, and eventually dealing with retention and storage growth as your metric cardinality climbs. Grafana Cloud's pricing page offers a free tier that removes the self-hosting half of that — 10,000 active metric series and 50GB of ingested logs, traces, and profiles a month, with 14-day retention across the board — which is a reasonable way to try the tool before deciding whether the full self-hosted version is worth your time. But even on the hosted free tier, you're still building dashboards and instrumenting your app to emit metrics worth looking at, which is real, ongoing work that an uptime checker never asks of you.
Tool | Answers | Cost at small scale | Where it runs | Setup weight |
|---|---|---|---|---|
Uptime Kuma | Is it up right now? | Free (MIT license) | Must be off the box it watches | Low — one Docker container |
Better Stack (Uptime) | Is it up right now, without me hosting the checker? | Free up to 10 monitors, then paid | Hosted by Better Stack | Lowest — no infrastructure at all |
Grafana + Prometheus (self-hosted) | What is the shape of what's happening while it's up? | Free, but costs your time to run | Anywhere, ideally a separate box | High — two services, dashboards, upkeep |
Grafana Cloud | Same as above, without self-hosting Prometheus | Free to 10k series / 50GB a month | Hosted by Grafana Labs | Medium — still requires instrumentation |
What each one actually costs you past the free tier
The free tiers are generous enough that most people never leave them, but it's worth knowing what the next step up looks like before you pick, because switching monitoring tools later is more annoying than switching most things. Uptime Kuma has no next step at all — it's the same self-hosted software whether you're checking one endpoint or two hundred, so the only cost that grows is the size of the box you're running it on, which for anything short of an actual monitoring product stays trivial. XenGrowth on governed AI marketing workflows approaches this from the AI agents and marketing automation side.
Better Stack's paid tiers buy faster checks (down to 30 seconds instead of 3 minutes) and more monitors, billed on what they call all-you-can-alert pricing rather than a hard per-notification cap — reasonable for a team, unnecessary for one app where a 3-minute detection window on a false alarm costs you nothing. Grafana Cloud's paid tier is usage-based on metric series and data ingested, starting around $19 a month base plus consumption, which only becomes real money once you're instrumenting enough of your app that the free tier's 10,000 series and 50GB actually get consumed — for a single small service, that ceiling is higher than it sounds.
Question you're actually asking | Best-fit tool | Why the others fall short here |
|---|---|---|
"Is my app reachable right now?" | Uptime Kuma or Better Stack | Grafana can answer this too, but only after you've built a dashboard for it — overkill for one boolean |
"Why did latency spike at 3am last Tuesday?" | Grafana + Prometheus | Neither uptime tool stores the granular history needed to answer a 'why', only a 'when' |
"Did my TLS cert just expire?" | Better Stack or UptimeRobot's SSL check | Uptime Kuma doesn't check certificate expiry natively; Grafana would need you to scrape it yourself |
"Is container A quietly leaking memory over days?" | Grafana + Prometheus, or Netdata's own retention | An uptime checker has no concept of a trend, only a pass/fail at each interval |
So which one do you actually need?
For a single self-hosted app run by one person, the honest answer is usually just an uptime checker, run somewhere that isn't the box it watches, plus the host and container metrics covered in the companion post on this stack. That's Uptime Kuma on a second free-tier box, or Better Stack's free tier if you'd rather not run even that much. Either gets you the one alert that matters — something is unreachable — without a second stack to maintain.
Choose Uptime Kuma if you already self-host everything else and don't mind standing up one more small box to run it on
Choose Better Stack (or UptimeRobot's free plan) if you'd rather not run any infrastructure at all for this one job
Reach for Grafana and Prometheus only once you have more than one box to correlate, a custom metric no checker exposes, or a team that needs a shared dashboard rather than one person's terminal
Don't reach for the full observability stack because it looks more legitimate — a dashboard nobody queries is worse than no dashboard, because it creates the appearance of coverage that isn't there
Most small self-hosted apps never reach the point where Grafana earns its weight. That's not a knock on Grafana — it's a genuinely good tool for a question most one-person projects aren't actually asking yet.
A short checklist before you commit to one
Count how many things you're actually watching right now. If it's one app and one database, you don't need a query language for it — you need a pass/fail check and a place to run it.
Ask whether you're solving 'is it up' or 'why is it slow.' Those are different questions with different tools, and conflating them is how a simple checker turns into an afternoon spent learning PromQL for no reason.
If you're leaning self-hosted, decide where the checker lives before you install anything. That single decision — off the box being watched — matters more than which tool you picked.
If you're leaning hosted, read the free tier's limits against your actual monitor count before assuming you'll stay under it forever; Better Stack's 10 monitors and 3-minute checks are generous for one app, tight for five.
Revisit the decision when something changes, not on a schedule — a second server, a customer-facing SLA, or a metric you keep wishing you could see historically are all real reasons to move up a tier. 'It felt like time' is not.
None of these tools are wrong choices in the abstract — Uptime Kuma, Better Stack, and Grafana are all well-built for what they're for. The actual mistake is skipping the first question and picking based on which one sounds most like what a serious operation would run, instead of what the specific app in front of you actually needs watched this month. XenGrowth on building one SEO and GEO content system approaches this from the AI search, GEO and discovery side.
The mistake that costs you the most either way
Whichever tool you pick, the deployment detail that matters more than the choice itself is where it runs. Uptime Kuma on the same box it watches, or a Grafana instance whose only alerting path is an email that goes to an inbox you check twice a week, both defeat the purpose regardless of how capable the underlying tool is. The next post in this series goes into what actually makes an alert useful once one of these tools decides to send you one — what a real healthcheck should assert, and how to avoid alert fatigue — because picking the right monitor is only half the problem.
One more thing worth saying plainly: none of these three tools are mutually exclusive, and running two isn't a sign you did it wrong. Uptime Kuma or Better Stack for the boolean question, and Grafana later once you have a genuine 'why' to answer, is a perfectly normal pair to end up with. What's worth avoiding is the version where you install all three because a comparison post made each one sound necessary, and then only ever look at the dashboard from whichever one happened to be open when something broke.
Further reading from XenGrowth
The XenGrowth resource library — what you'll learn: how the commercial side of this work is run, across search, automation and revenue operations.
XenGrowth on governed AI marketing workflows — what you'll learn: how the teams running AI marketing agents keep them governed and measurable.
XenGrowth on building one SEO and GEO content system — what you'll learn: how search and AI-answer visibility get run as a single content system.
Where this work meets go-to-market
If uptime kuma vs better uptime vs Grafana is part of a growth programme rather than a standalone build, the XenGrowth practice is the companion reading.
Four questions about what you're protecting and who's on the hook. The post's argument is that most people either under-monitor or buy an observability stack they'll never look at; this walks the same line.